
How Much Does a Heat Pump Cost?
This is probably the most common question asked about the technology. There are many variables that will change the answer, but if you live in the US or Canada I have an analysis for you.
The biggest cost factors are:
The equipment size and the methods of installation (central ducting vs wall heads). Your equipment size is NOT determined by the building square footage. It is determined by the design heating and cooling load, which is a calculated value based on your building envelope and climate.
How do I know my heating and cooling load?
The simple answer is to hire someone who’s qualified to calculate it. Peak Thermal Load (PTL) and Peak Cooling Load (PCL) are different values and relate to different performance aspects of a system.
Long story short: get the building modelled by someone experienced and professional. In Canada that will be a well regarded EA, in the US a HERS modeller. Yes many HVAC companies will do a heat load calculation for you, and it may be good enough… but it may not be. Blower door data is crucial to getting an accurate design load, especially for heating as the pressure and temperature differential in winter is often much higher, and shading analysis is crucial for accurate cooling load. More on determining design loads in future articles.
I work in Kelowna, BC in Canada as a Registered Energy Advisor and aside from doing whole home energy evaluations and building investigations, I provide CSA standard F-280-12 calculations for buildings. To determine the energy loads we model the building envelope which is the entire exterior shell of the building that separates the interior air from the outdoor environment. To do this we determine the construction methods and materials, the windows and doors, insulation levels, and the air leakage of the building by pressure testing. We then model the energy usage using a number of different methods, but for me generally I use PHPP (Passive House Planning Package) and Hot2000 energy modeling for Energuide compliant report generation.
In my expanded role as a deep energy retrofit designer and passive house consultant (CPHC) I also build the whole home and surrounding area in 3D to determine all the shading factors on the building and how those influence the energy loads. You can imagine that two identical buildings with a lot of west facing window area could have dramatically different cooling loads.
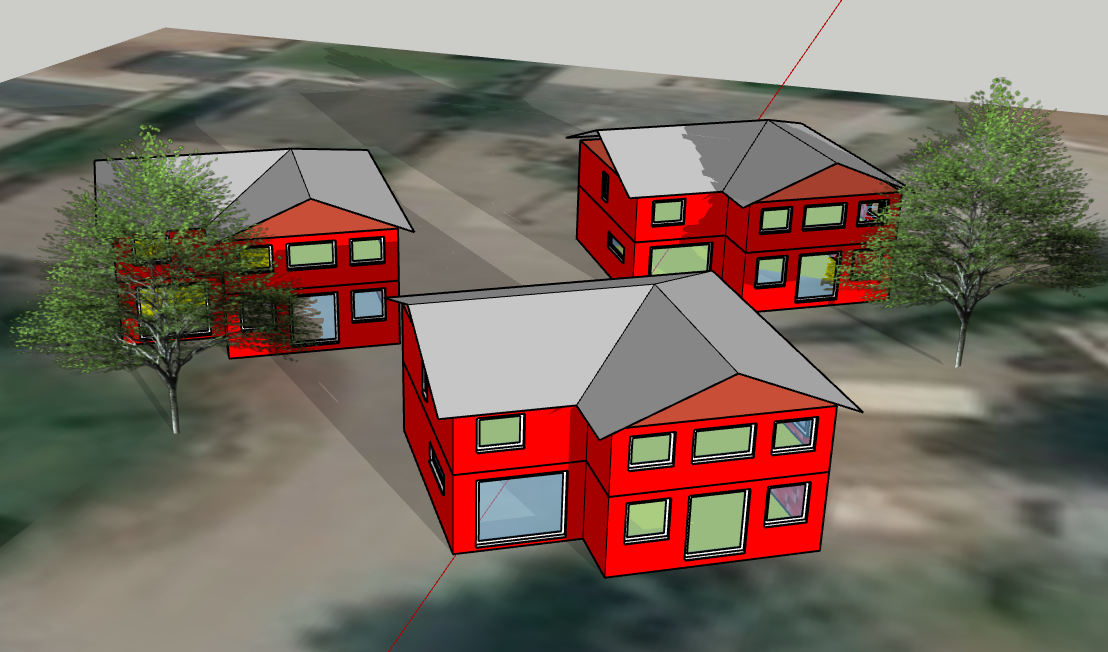
The rendering above shows the same house built in the same neighbourhood in three vastly different energy realities based on their unique situation.
Based on a few trees or near by buildings that block much of that solar energy from entering one of the buildings the cooling load changes dramatically. Inversely the building experiencing the increased shading situation resulting in a lower cooling load will require more heating energy from the loss of solar heat gains in the winter. This is a relatively simple way of illustrating some of the differentials that need to be accounted for, but hopefully communicates the concepts well.
If you are a homeowner and read all of this, I’m proud of you. I hope it’s given you a small bit of information to empower you to begin understanding your home heating and cooling needs and how they are calculated. Stay tuned for subsequent articles going more in depth on the effects of building envelope improvements and the true economic costs of pursuing (or not pursuing) them. The graphs below are a product of a data analysis I conducted of the publicly available data in the link citation at the bottom of this page.
The graph below shows the data of the average quoted heat pump cost for a home based on country and system size in 1000’s of BTUs.

Average quoted cost based on publicly available data cited below
This graph below shows the anticipated monthly equipment cost of these units based on depreciation to 0 over an anticipated 15 year service life.

Equipment depreciation expressed as monthly cost.
Methodology:
I started with entire data set in google doc spreadsheet on 2024-02-19 at
https://docs.google.com/spreadsheets/d/1hBebytdBOzLQ4eoAbdFQl2PbNjWdzHqijVa4BfaYHSc/edit?usp=sharing
Removed problematic data with the objective of getting closer numbers for whole home systems rather than single rooms.
REMOVED DATA
- Items with single head
- Items with no BTU rating listed
- Outlier data deleted
o Canada removed one item from 18k btu data showing 1399 as outlier suspected homeowner equipment cost purchase, and all lines exceeding $1/BTU rated capacity deleted (cost appears unrealistically high and is likely from a quote to install an entire dual fuel system)
o USA Removed data returning more than $1/ BTU system rating
This left 540 total data sets to analyze. While I can in no way verify the accuracy of the numbers as they are consumer reported figures, taken as a larger data set they carry weight and align with the numbers I’ve seen in the field.